The Beginner’s Guide to Google Analytics for Bridal Retailers
In a recent poll, we asked Bridal Retailers which topic they were most interested to learn more about and Google Analytics was the frontrunner. With all of the different strategies that are thrown in your face as a store owner constantly (You have to be doing Facebook Ads, Now Yelp, How’s your Google my Business Profile?, etc..), it makes sense that stores want to know how to read this data themselves.
The first step in creating successful campaigns is knowing how to tell if the campaign was successful. Enter, Google Analytics.
Let’s start off with a basic description.
What is Google Analytics?
Google analytics is a free tool that analyzes the people that come to your website. It can tell you a lot of amazing things like, the percentage of people who visit your website on a phone versus a tablet, or the percentage of your website visitors that are female. The challenge with Google Analytics is that there’s so much data, it’s difficult to understand what information is most important to your bottom line.
Today, you’re going to learn about 4 reports that you should be reviewing on a monthly basis:
- Audience Overview
- Acquisition Overview
- Behavior Overview
- Geo Overview
Before we go over the details of these different reports, let’s step back and go over how you go about getting Google Analytics on your website. Most website platforms support an easy implementation of Google Analytics, but the process will vary. I am going to send you in the right direction but you might need to contact your web developer for specific instructions.
For the first step, you’ll want to head over to analytics.google.com and create an account. Once you’ve created an account, sign in and head over to the ‘Admin’ section:
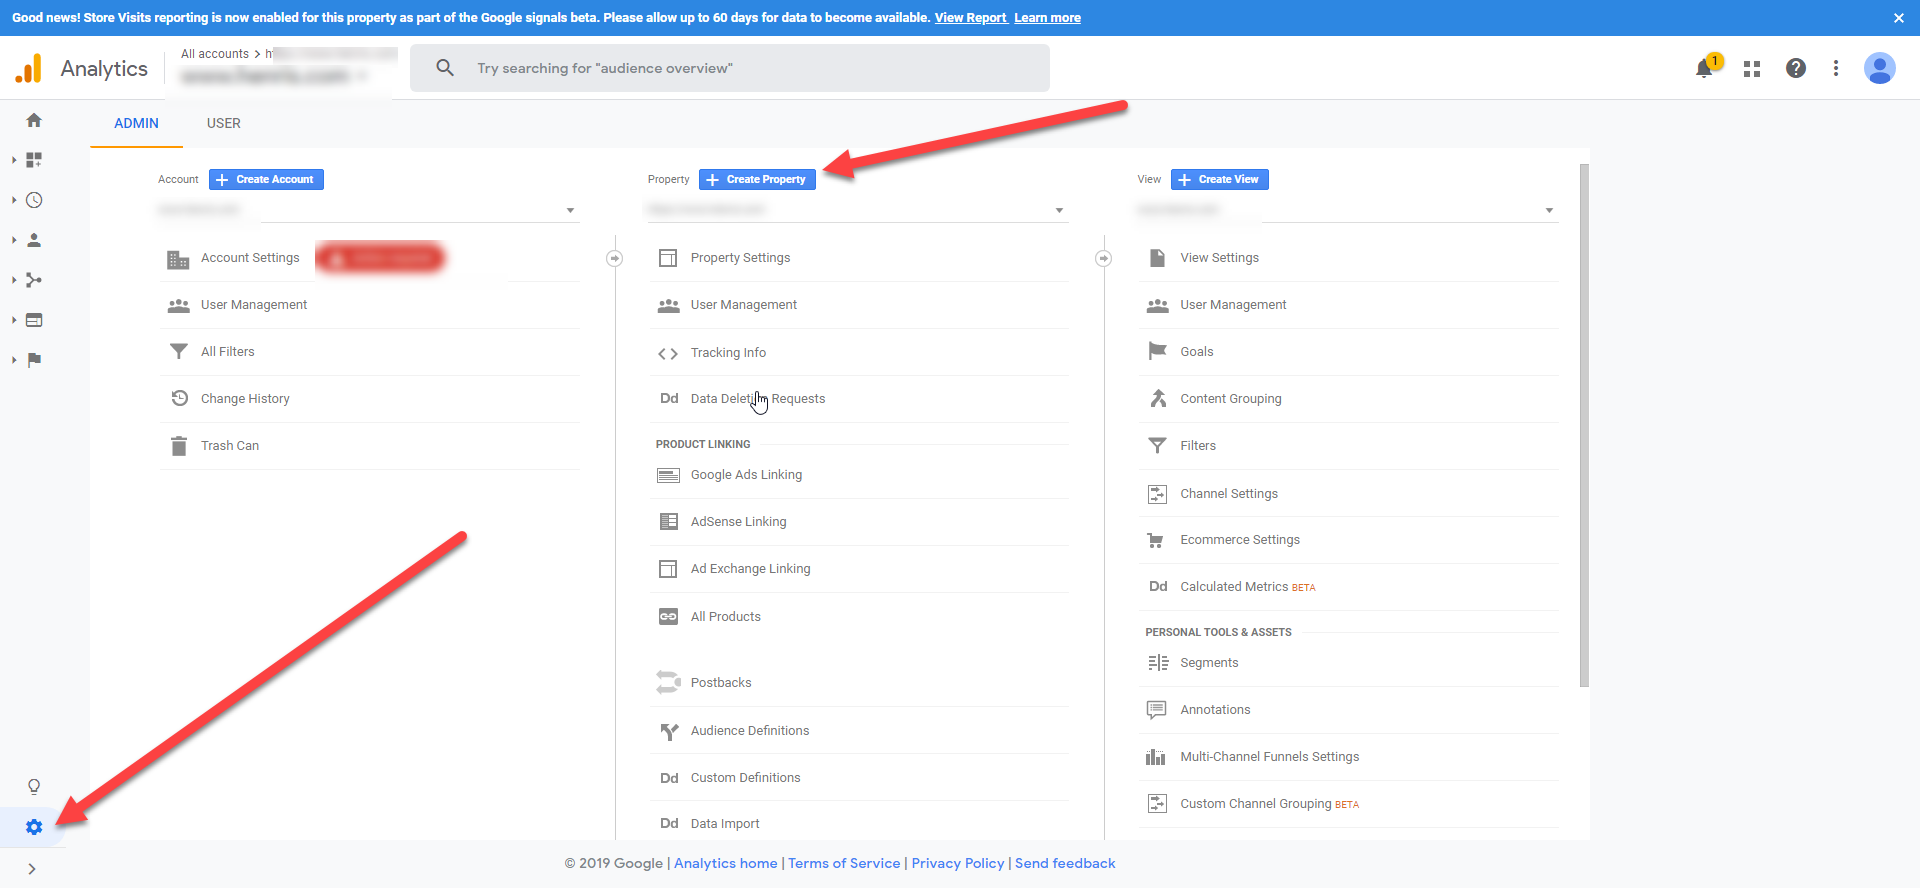
Then choose the option to ‘Create Property’ and enter in your website’s URL (SYVO’s URL is syvo.com for example).
Now you need to install the Google Analytics tag on your website. This is the part where I link you to Google’s official support article on this matter, as the steps will be dependent on what type of website you have:
Click here to view Google’s guide on setting up the Google Analytics Tag on your website
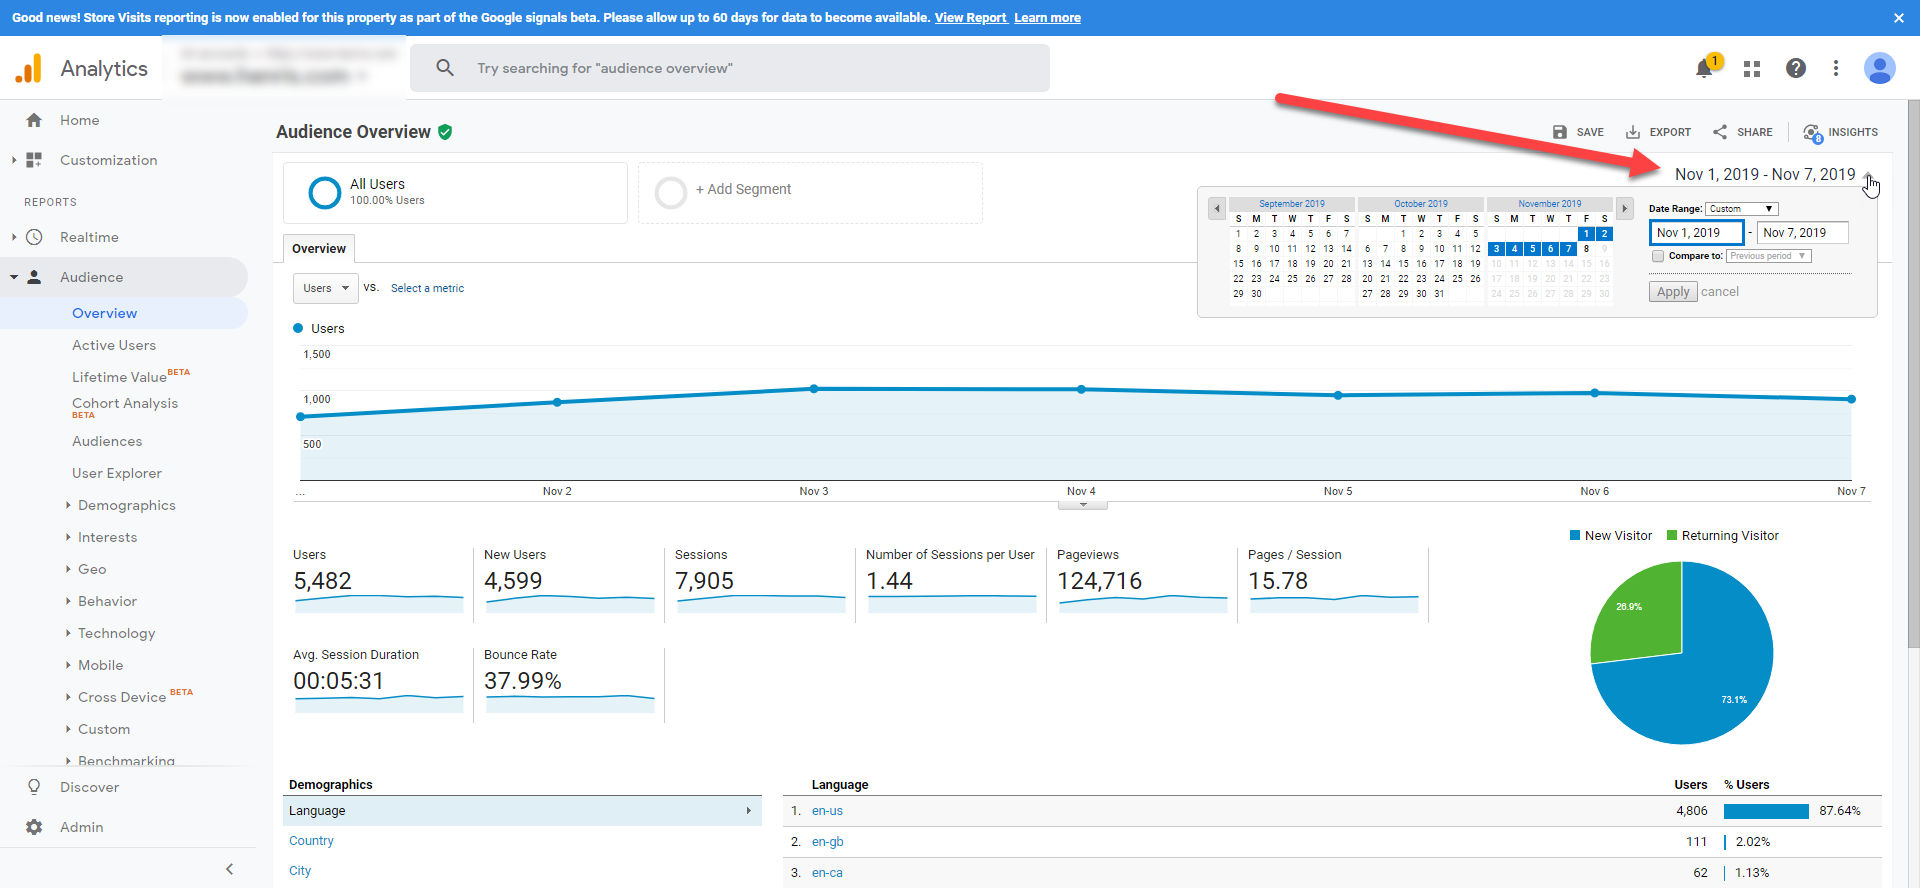
Before diving into these different types of reports, please be aware of the date range that you are examining. In the picture below, I’ve highlighted the area where you can adjust the date range. I recommend changing this toggle to cover the last 30 days when reviewing your data, and if you have had Google analytics installed on your website for a longer period of time you can even check the box ‘Compare to Previous Year’ to get comparisons of how your website is performing overtime.
Audience Overview
The Audience Overview report is going to tell you what type of experience your customers are having on your website. Specifically, it’ll tell you:
- How many new, and repeat, visitors came to your website in a given period
- How many pages those visitors looked at when they came to your website
- How long those visitors stayed on your website
- How many of those visitors left without visiting more than 1 page on your website (This is called bounce rate).
When you have enough data to compare year over year, ask yourselves these questions:
- Did I have more or less users on my website this year compared to last year
- Are people spending more than 2 minutes on my website on average?
- Do more than 50% of my users leave before visiting more than one page (Bounce rate > 50%?)
- Are people visiting more, or less, pages on my website this year compared to last year.
Answering those questions will tell you if you are on a positive trend (i.e., you have more people on your website this year compared to last year), or if there is a problem that needs fixing (i.e. you have less people on your website this year compared to last year).
Protip: Click the ‘share’ icon at the top to setup scheduled emails of this report! You can have this emailed to you every month, week, and more!
Acquisition Overview
The Acquisition Overview report contains some of the most important information about the performance of all of your online efforts. It is going to tell you how people are finding your website.
Google breaks it down into the following categories:
- Organic Search: This is everyone’s favorite! “SEO”! Organic search refers to the number of people that found you on a non-paid Google Ad search.
- Direct: This refers to the people that knew your website, and typed it directly into their browser.
- Social: This shows you each one of your social networks and how many people came from each.
- Paid Search: This shows you how many people found you from a Google Ad
- Referral: This shows you how many people found you from other people’s websites (like your designers)
You can click into each category to see more specific information. In a perfect world, your organic search will be significantly higher than your other channels (because it is very cheap, and not reliant on any other third party like ‘’referral’ and ‘social’ channels are). You can see how much traffic ‘TheKnot’ and your designers’ Store-Finders are sending you by clicking into ‘Referrals’.
DEFINITELY compare these results to the previous year (if you have had analytics on your website) and look to see how your organic search has changed. If you notice a negative trend when comparing to the previous year, you will need to dive deeper into your SEO strategy. If your current SEO strategy is not bringing more people to your website organically year over year, then you’re doing something wrong.
Behavior Overview
The Behavior Overview report is going to tell you about the pages on your website and how frequently they are being viewed. The higher the pageviews on your website, the better. More advanced users can use the behavior report to drill down into certain pages to discover pages that are causing people to leave, and other useful methods.
More to come about the Behavior report in our Advanced Series! Stay tuned!
GEO Overview
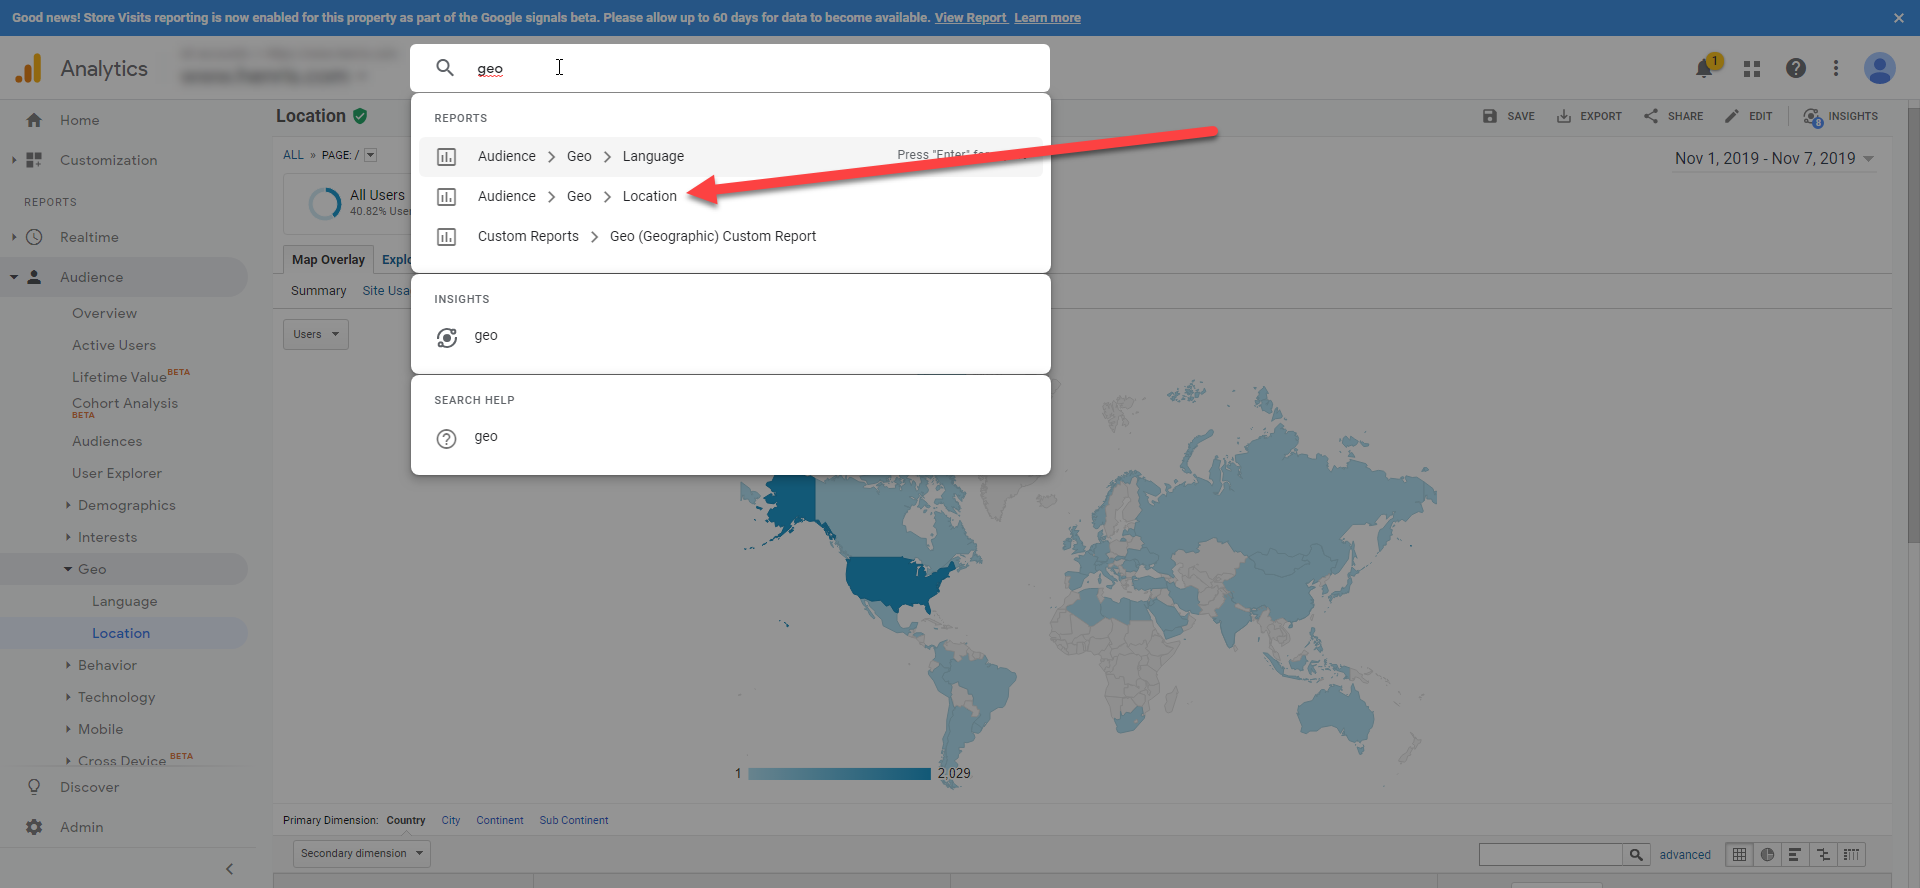
The GEO overview is a very useful tool that will show you exactly where your site visitors are coming from. The quickest way to access it is by typing in ‘Geo’ in the search bar at the top, and then clicking the option for ‘Audience – > Geo – > Location:
When you land on the GEO Location report, you’ll start at the Country level. Click on ‘United States’ (if you’re in the state) to start drilling down to the state, and city level. Review the cities and make sure that you are seeing the locations that you should be drawing from! Don’t see a particular city? Create a page on your website that is targeted at that location! Adjust your ads to include that location in your target audience. Whatever action you take, the point is that this report is going to tell you if your efforts are reaching customers in relevant areas to your store. If the areas are not relevant, take action to attract brides that are in your area!
There are some topics we did not go over in this section but keep your eyes out for another post on Analytics to cover the most important metric in the website game….Conversions.
I hope this information helps you understand a little more about what people are doing on your website, and what to look out for! Come by our chat or shoot me an email if you have any questions or need any help!